
What an impression on LinkedIn means
An impressions glossary written for the buyer who got an analytics screen and just needs the truth. Every metric defined, every threshold cited from LinkedIn's own help docs, every vs comparison resolved with a worked example.
What an impression on LinkedIn actually means
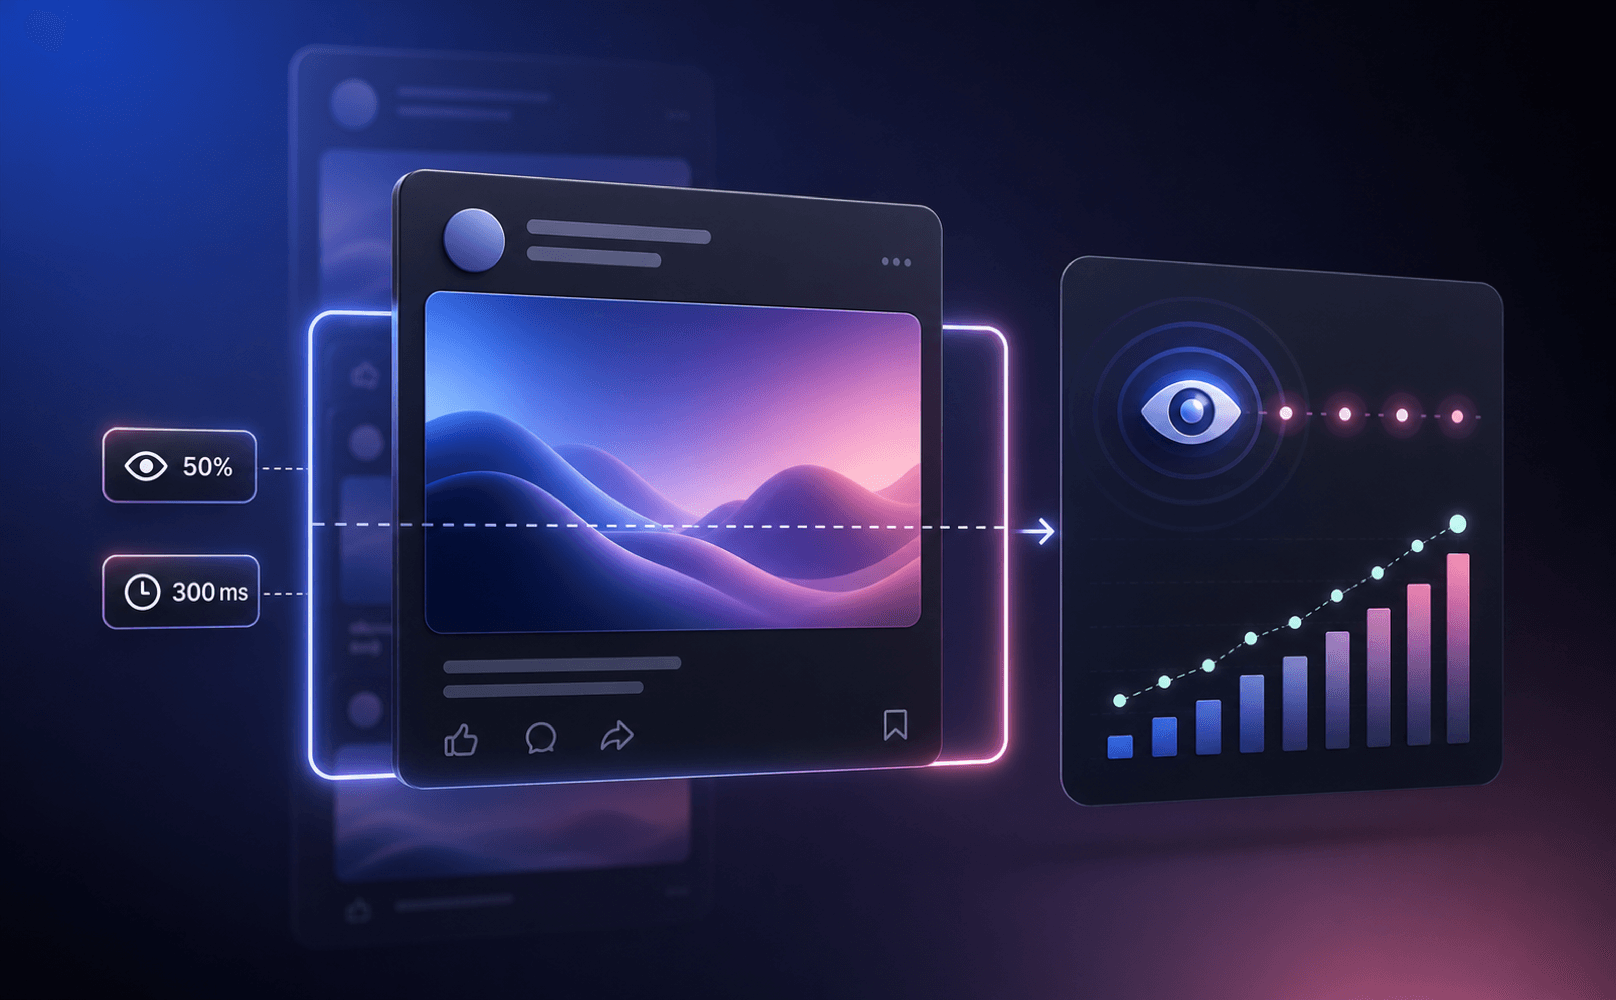
An impression is logged when a piece of content is shown on a signed-in member's screen. That is the entire definition. The threshold is at least 50% visibility for at least 300 milliseconds. If you scrolled past a post three times today, that post recorded 3 impressions from you. Repeat displays count.
Sponsored Content uses a slightly stricter rule for desktop: at least 50% in view for at least 1 second (LinkedIn Marketing Solutions, March 2018 standard, still current). Mobile sponsored stays at 300 milliseconds. The two thresholds drift only inside ad reporting; organic post analytics use the unified 50%/300ms rule.
The official LinkedIn definition, verbatim
From LinkedIn's own help center, post analytics page (linkedin.com/help/linkedin/answer/a516971):
- Impressions: "The number of times your post was shown on LinkedIn."
- Members reached: "The number of distinct members and Pages that saw your post. This number is an estimate and does not include repeat displays."
- Video views: "The total number of times your video was watched for two or more continuous seconds, including replays."
From the Campaign Manager performance metrics page (linkedin.com/help/lms/answer/a445476/), an ad impression is recorded when the ad is at least 50% in view for at least 1 second on desktop or 300 milliseconds on mobile.
Why your impression number is an estimate
LinkedIn's help page on post analytics carries an explicit disclaimer: the numbers in your post analytics are estimates and may not be precise. The platform deduplicates partially, samples at scale, and reconciles delayed events from mobile. A 5,200 impression count seen this morning may settle at 5,180 or 5,240 by tomorrow. The right way to read the number is to one significant figure of confidence, not to the unit.
Impressions vs members reached
These are the two numbers next to each other on every post analytics view, and they confuse buyers more than any other pair.
- Impressions: total displays. Includes repeats. The same person scrolling past three times = 3 impressions.
- Members reached: distinct accounts. Deduplicated. The same person scrolling past three times = 1 member reached.
Members reached is the closer proxy for actual audience size. The ratio of impressions to members reached tells you how often your audience saw the post on average. Three or more impressions per member usually means the post got picked up in multiple feed sessions. One impression per member means a single distribution wave, no return visits.
Impressions vs views
LinkedIn uses both terms in the UI, but they describe different actions.
- Impression: passive surfacing. The content rendered on screen. No click required.
- Post view: active expansion. The member tapped see-more or opened the full post. A subset of impressions.
- Video view: at least 2 seconds of continuous playback with at least 50% of the player on screen, including replays.
A post with 8,000 impressions and 600 see-more clicks had a roughly 7.5% expansion rate. The expansion rate is more useful than raw impressions for guessing whether a hook actually pulled people in.
Impressions vs reach vs unique impressions
Three labels for two underlying numbers. Impressions count every display. Reach and unique impressions both count distinct members. On Pages, LinkedIn calls the deduplicated number reach. On personal post analytics, it is members reached. On Campaign Manager (ads), unique impressions is the same idea: distinct accounts that saw the ad at least once.
Impressions vs engagement
Engagement counts active member behavior: reactions, comments, shares, link clicks. Impressions are the denominator; engagement is the numerator. The ratio is your engagement rate. Socialinsider's 2026 benchmark study (1.3 million LinkedIn posts, 16,645 pages, March 2026) puts the median engagement rate by format at: native document 7.00%, multi-image 6.45%, video 6.00%, image 5.30%, text 4.50%, poll 4.20%, external link 3.25%. Below 2% on a B2B founder profile is a hook problem, not a distribution problem.
Profile impressions vs profile views
On the profile side, LinkedIn does not call the surfacing number impressions. It calls it search appearances: how often your profile appeared in search results for queries by other members. Found at Profile then Analytics then Search appearances on a 7, 28, or 90 day window.
Profile views is the conversion layer: distinct members who actually clicked through to your profile from search, a post, a comment, or a notification. The relationship is search appearances, then profile views, then connection or DM. For founders running outbound, search appearances for category keywords your buyers type is the upstream metric that actually predicts inbound.
Organic, paid, and viral impressions
Three ways an impression can be generated, and they live in three different reporting surfaces.
- Organic: a post or article shown in feed, search results, profile, notifications, or LinkedIn newsletter delivery. Reported in post analytics or page analytics.
- Paid (sponsored): ads served via Campaign Manager. Reported in Campaign Manager. Stricter desktop threshold (1 second).
- Viral: a paid impression generated because a member shared the Sponsored Content to their own network, and another member then saw the share. Reported separately from baseline ad impressions in Campaign Manager.
If you run both organic and paid, the totals do not reconcile across surfaces. They are not supposed to.
Mobile vs desktop thresholds (sponsored only)
The mobile vs desktop gap exists only inside Campaign Manager ad reporting. Desktop sponsored = at least 50% in view for at least 1 second. Mobile sponsored = at least 50% for at least 300 milliseconds. The 1-second desktop threshold is the loud rule because most B2B targeting buys serve heavily on desktop, where eyeballs are larger and slower.
Organic post impressions use the unified 50% / 300 ms rule across surfaces. Third-party blog posts that quote a 1-second rule for organic posts are conflating the two specs.
Video impressions: the 2024 and 2025 changes
Two specific updates that buyers reading old guides keep getting wrong.
- August 2024: video impressions are only reported if they were generated from valid impressions, that is, impressions where the video actually began to play. Filters out non-rendered ad impressions.
- March 2025: completion rate denominator switched to impressions (MRC alignment). Completions are watches that reach 97 to 100% of the video length, including watches that skipped to that point.
If your campaign reports lower video impressions in 2026 than the same campaign would have reported in 2023, the 2024 validity rule is usually why. Not a tracking break.
Worked example: 8,500 impressions, 2,100 reached
Your post analytics tile shows 8,500 impressions and 2,100 members reached. What that actually says:
- 2,100 distinct accounts saw the post at least once.
- On average, each of those accounts saw the post about 4 times (8,500 / 2,100 = 4.05).
- The post got picked up across multiple feed sessions, not a single distribution wave.
- If 600 of those 2,100 are ICP-fit titles in your CRM, your effective audience for outbound follow-up is 600, not 8,500.
- If 50 of those 600 actively engaged (comment, share, react), those are the prospects worth opening a DM with inside the next 48 hours.
Two numbers in your dashboard, five derived numbers worth looking at. The 8,500 is for slide decks. The 50 is for pipeline.
Where impressions come from
The five surfaces that generate impressions on a typical post:
- Feed: the largest source for an active poster. The 360Brew ranking decides who sees it.
- Search: members who searched a topic and saw your post in results.
- Profile: a visitor scrolled past your post on your profile activity.
- Notifications: a member tapped a notification (someone they follow commented or reacted) and saw the post.
- Newsletter delivery: subscribers received the issue and viewed it in their inbox-style view.
Native dashboards aggregate all five. There is no breakdown by source on personal profiles, which is a real reporting gap.
Do self-views, bots, and accidental scrolls count?
LinkedIn does not publicly state whether self-views (you scrolling past your own post) are excluded. Community consensus and LinkedIn rep replies in support threads suggest they are counted, which is one reason your impression count rises slightly even on posts no one engages with.
Bots and automated accounts are filtered against the 50% / 300 ms threshold by design (a bot scrolling at 50 ms per post does not register), and against LinkedIn's bot-detection layer. Accidental scrolls do count if the post stays on screen for 300 ms with 50% visibility, which is why scroll-fast text posts still log impressions even when no one read them. That's the gap between impressions and engagement.
From impressions to pipeline
Impressions are a distribution number. Replies are a pipeline number. The bridge between them is whether someone in your ICP engaged with the post and whether you reached them inside the relevance window. Industry data: signal-triggered outbound at under 25 invites per week converts at 40 to 60% accept rate; cold blasts at 100 invites per week convert under 15%. Inbound-led outbound (post engagement plus contextual DM) converts at about 14.6% reply rate vs 1.7% for cold (PhantomBuster, LinkMate 2026).
Sonarly turns post engagement into a buyer signal. Personal-comment and personal-post are 2 of the 5 signal source types in Sonarly's library, and the 48 predefined intent patterns include detecting when an ICP-fit decision-maker engages with a post that matches your value proposition. The system surfaces them, drafts the contextual DM in your voice, and you approve before send. The whole loop targets the 48-hour window where reply rates are 5 to 8 times the cold baseline.
Frequently asked questions
An impression is logged when a post is at least 50% visible on a signed-in member's screen for 300 milliseconds or longer. Every display counts, including repeat displays to the same person. Sponsored video uses a different threshold: 2 seconds of continuous play with at least 50% of the player in view.
On LinkedIn the two terms are sometimes used interchangeably in the UI but they are not the same. Impressions count every display of a post (so the same person scrolling past three times is 3 impressions). Views can refer to either total displays (mirroring impressions) or to deeper engagement (paid video views require 2 seconds of play). Reach is the cleaner counterpart: distinct members who saw the post.
Total impressions count every display, including repeats. Unique impressions count distinct members who saw the post at least once. A post with 5,000 total impressions and 1,500 unique impressions had each unique viewer see it about 3.3 times on average. Unique impressions is the closer proxy for actual reach.
Profile impressions, technically called search appearances on LinkedIn, count how often your profile showed up in search results for queries by other members. Find them at Profile → Analytics → Search appearances on a 7, 28, or 90 day window. They are not the same as profile views, which count distinct visits to your profile.
Two structural reasons. First, LinkedIn rolled out 360Brew in late 2025, a new ranking model that semantically scores expert relevance and detects engagement-bait. Second, distribution concentrated: top creators now hold 31% of feed visibility (up from 15% in 2022), regular accounts dropped from 57% to 28% (LinkBoost 2026). On Company Pages, organic reach now sits at ~1.6% of followers, down 60-66% since 2024.
Per-post analytics are available for up to 365 days from the post's date. Profile-level post impressions are available on a rolling 28 or 365 day window. Search appearances are limited to 7, 28, or 90 days. There is no native bulk export. For longer history you need a third-party tool that snapshots the data continuously (Shield, AuthoredUp, Inlytics).
Not natively beyond the rolling window. Shield ($25/profile/mo), AuthoredUp ($19.95/mo), Inlytics (freemium), and Taplio ($39+/mo) all provide CSV or PDF exports of impression history. Each tool snapshots data over time, so you only get history from the date you started using it.
Yes, but as semantic SEO keywords for 360Brew, not as discovery channels. LinkedIn removed hashtag-following in 2024-25, so people no longer browse hashtags as feeds. Adding 3 to 5 hashtags (broad plus niche mix) still produces about a 30% lift over the zero-hashtag baseline, mainly because the model uses them to classify the post for relevance scoring.
Multiple independent studies (Algorithm InSights, ContentIn, LinkBoost 2026) put the reach drop for external-link posts at 40 to 60% vs comparable posts. LinkedIn's Sr. Director of Product publicly denied an intentional link penalty in August 2025. Treat the gap as algorithmic bias rather than policy. Putting the link in the first comment instead of the post body narrows the gap to about 5 to 10%.
Depends on follower count and format. Socialinsider's 2026 study (1.3M posts) shows median per-post reach for accounts with 10K to 50K followers: multi-image 1,850, video 1,420, image 1,450, native document 1,150, poll 1,255, text 845, external link 340. Below 1,000 followers, average per-post impressions are typically 100 to 400. The more useful question for B2B founders is: how many of those impressions came from ICP-fit accounts.
Stop optimizing for total impressions. Optimize for ICP-engaged impressions, then act on the engagers inside 48 hours. Industry data: signal-triggered outbound at under 25 invites per week converts at 40 to 60% accept rate, vs cold blasts at 100 invites per week below 15%. Inbound-led outbound (post engagement plus contextual DM) converts at about 14.6% reply rate vs 1.7% for cold (PhantomBuster, LinkMate 2026). The bridge is whoever in your ICP commented or repeatedly viewed your profile recently.
Founder profile, by a wide margin. B2B Page engagement ceiling is 2 to 5%; founder profiles routinely run 3 to 5x that. Page organic reach now sits at ~1.6% of followers (TryOrdinal Jan 2026). For early-stage B2B SaaS, the founder profile beats the Page on impressions per follower and on conversion to outbound replies, because LinkedIn's algorithm explicitly favors person-to-person feed content over Page content.